You need to set ENABLE_JITPROFILING=1.
For Julia < 1.9, you need to compile Julia from source with USE_INTEL_JITEVENTS=1.
using ThreadPinning
using IntelITT

# Multithreaded SAXPY kernel: Y[i] = a * X[i] + Y[i]
function saxpy_kernel(a, X, Y)
    Threads.@threads :static for i in eachindex(Y)
        @inbounds Y[i] = a * X[i] + Y[i]
    end
    return nothing
end

"""
  measure_membw(; kwargs...) -> membw, flops

Estimate the memory bandwidth (GB/s) by performing a time measurement of a
SAXPY kernel. Returns the memory bandwidth (GB/s) and the compute (GFLOP/s).

**Keyword arguments:**
- `pin` (default: `:compact`): pinning strategy (supported by ThreadPinning)
- `init` (default: `:serial`): initialize arrays in serial or in parallel (`:parallel`)
- `N` (default: `1024*100_000``): problem size, i.e. vector length
"""
function measure_membw(; N = 1024 * 100_000)
    bytes = 3 * sizeof(Float64) * N # num bytes transferred in SAXPY
    flops = 2 * N # num flops in SAXPY

    # pinning the Julia threads
    ThreadPinning.pinthreads(:numa)

    # initialize data in parallel
    a = 3.141
    X = Vector{Float64}(undef, N)
    Y = Vector{Float64}(undef, N)
    Threads.@threads :static for i in eachindex(Y)
        X[i] = rand()
        Y[i] = rand()
    end

    # warmup
    saxpy_kernel(a, X, Y)

    IntelITT.resume()
    t = Float64(Inf)
    for i in 1:10
        t_cur = @elapsed begin
            saxpy_kernel(a, X, Y)
            saxpy_kernel(a, X, Y)
        end
        t = min(t, t_cur/2)
    end
    IntelITT.pause()

    mem_rate = bytes * 1e-9 / t # GB/s
    flop_rate = flops * 1e-9 / t # GFLOP/s

    return mem_rate, flop_rate
end

measure_membw(; pin=:numa, init=:parallel)Make sure that you have password-less SSH access to the remote machine (e.g. compute node) that you want to profile on. In this example, the name of the remote machine is gpu-0002.
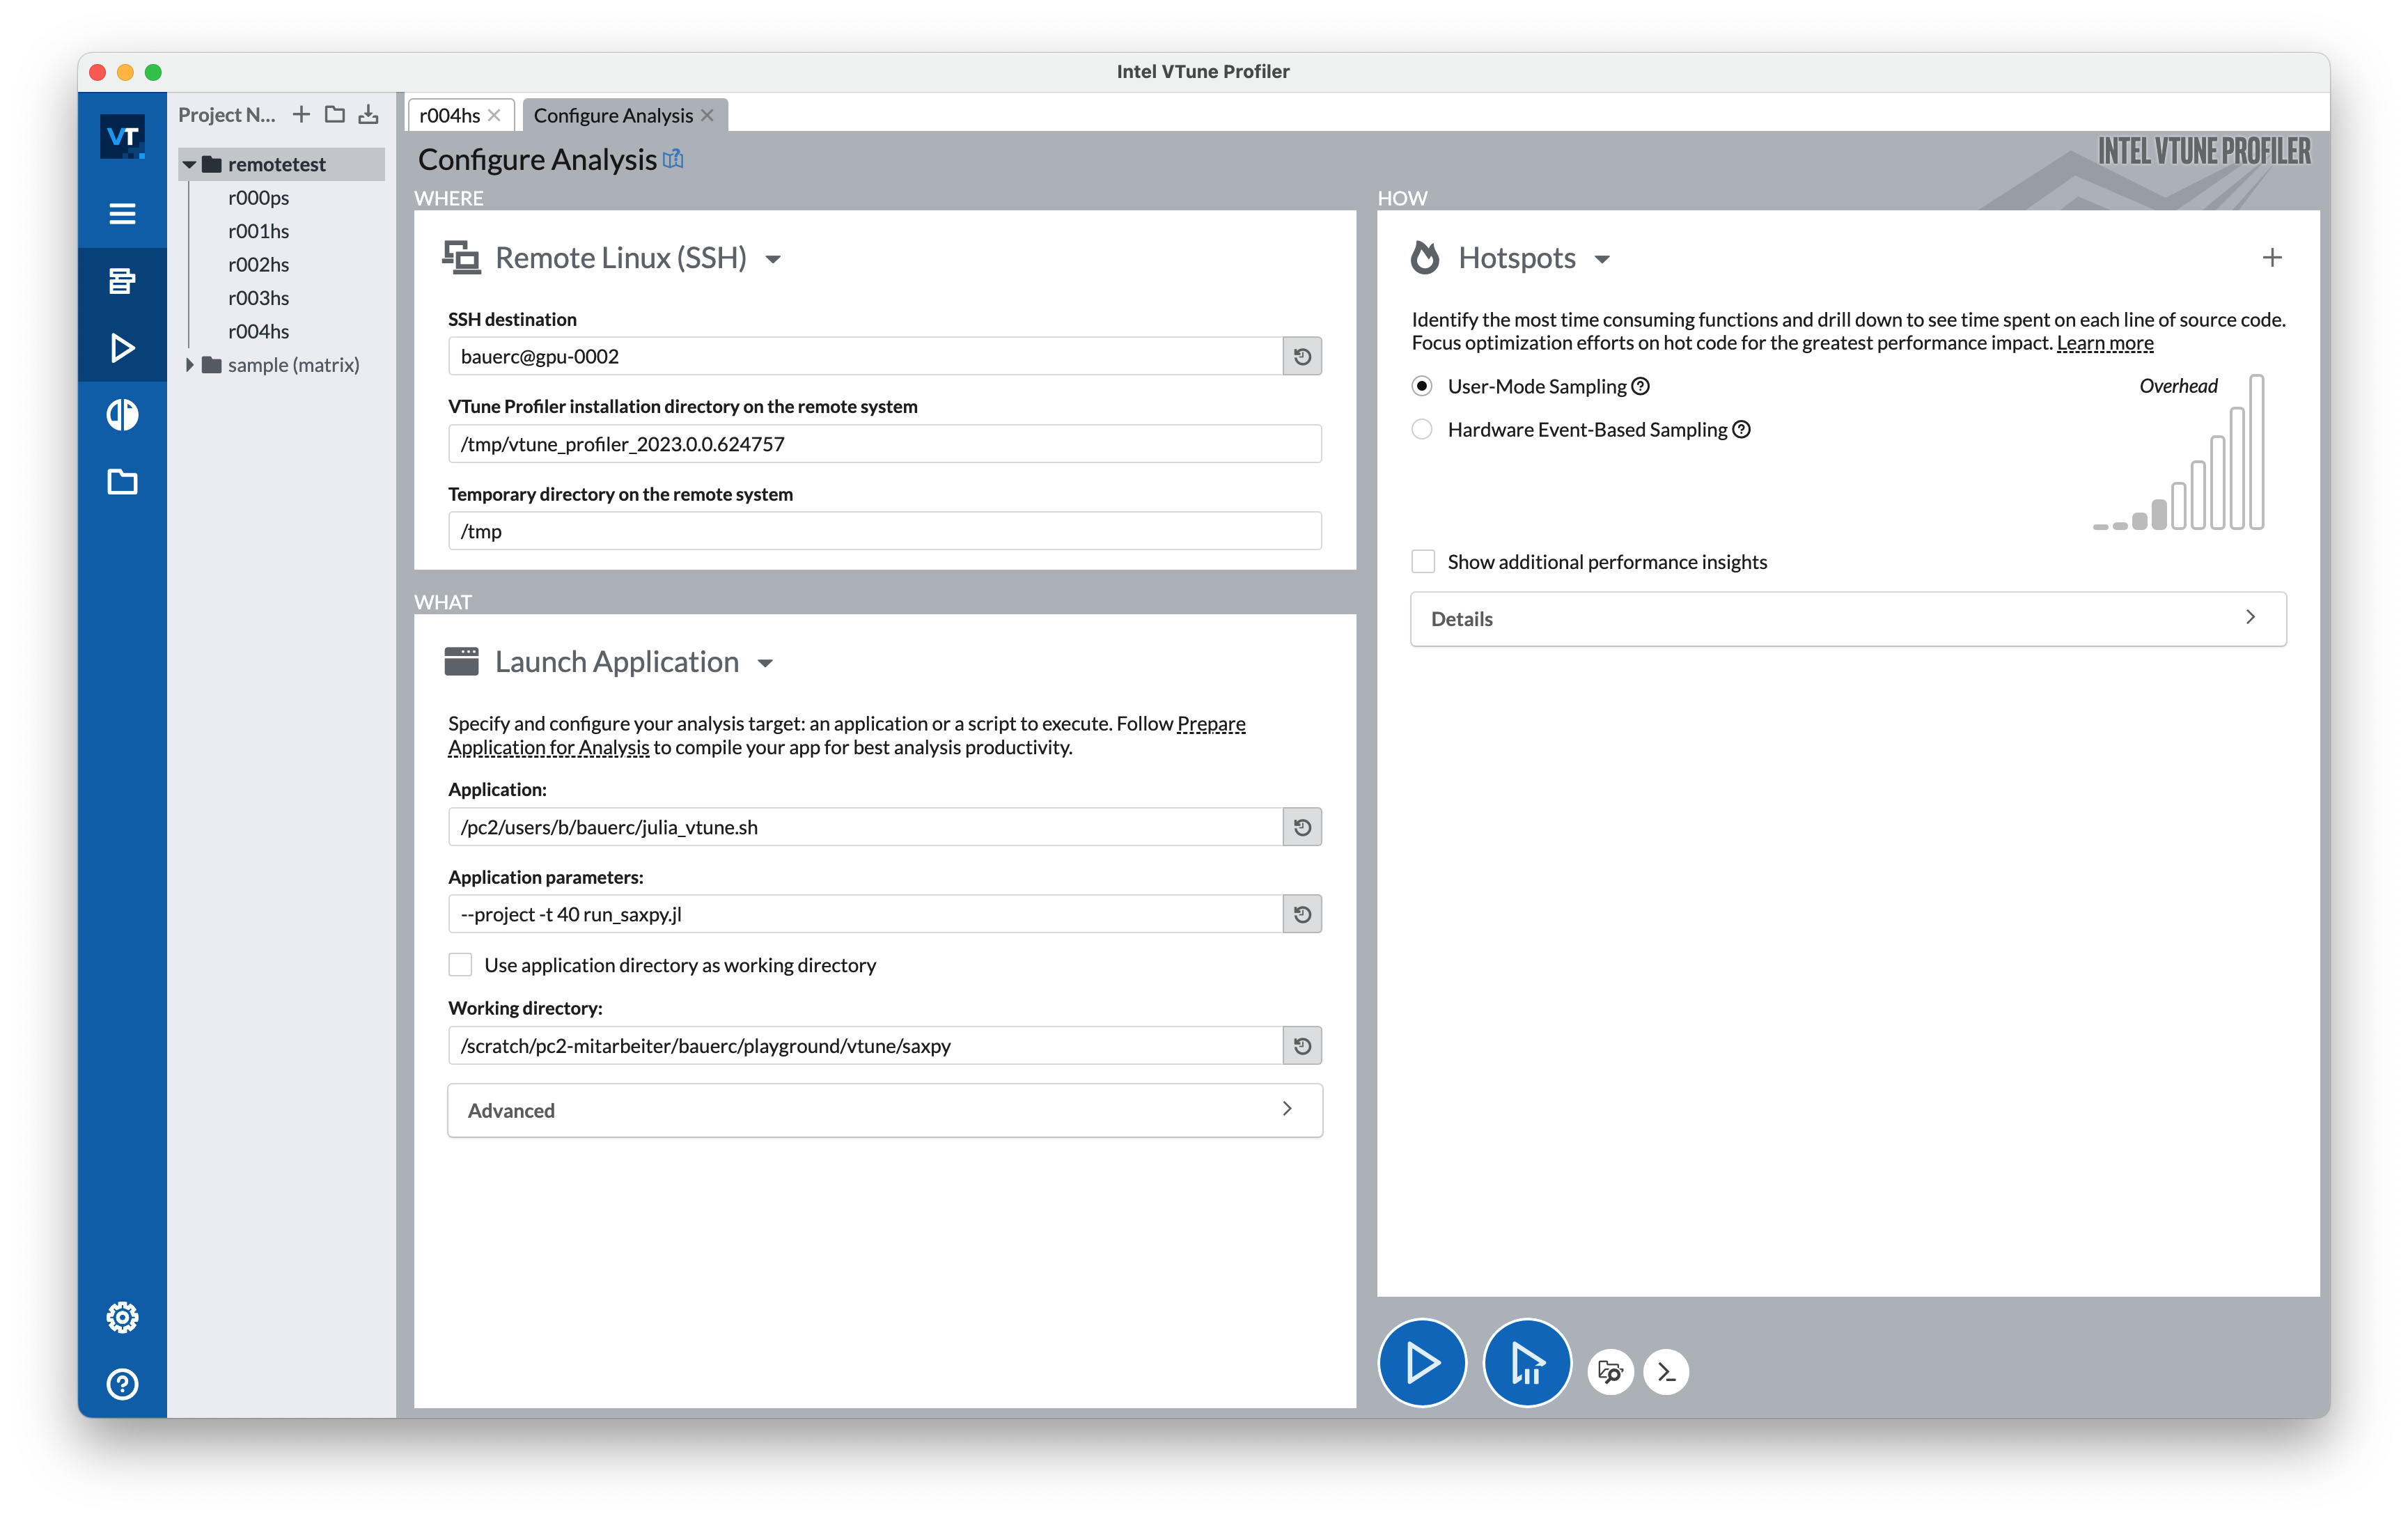
Start a new analysis. The "Configure Analysis" page should look similar to this:

Comments
The first time, you need to tell Intel VTune to install the necessary software tools for remote profiling via SSH. Just click on the "Deploy" button in the "Remote Linux (SSH)" tile (not shown). Afterwards, it should look as in the image above.
I use a little wrapper script julia_vtunes.sh under application. It loads the Julia module on the cluster, sets ENABLE_JITPROFILING=1, and then starts julia.
# julia_vtunes.sh

module load lang/JuliaHPC # cluster specific
export ENABLE_JITPROFILING=1
exec julia "${@}"
Wheter you use a julia wrapper or not, you must set ENABLE_JITPROFILING=1.
In the screenshot above, I've selected "Hotpots" as the analysis type (right pane). It's likely what you want to use.
Once everything is configured, press either on "Start" (play button) or on "Start Paused" (play + pause button). I recommend to use "Start Paused" in conjuction with using IntelITT.jl, i.e. IntelITT.resume() and IntelITT.pause(), in your code. This way, you can already pre-select the code region that you actually care about.
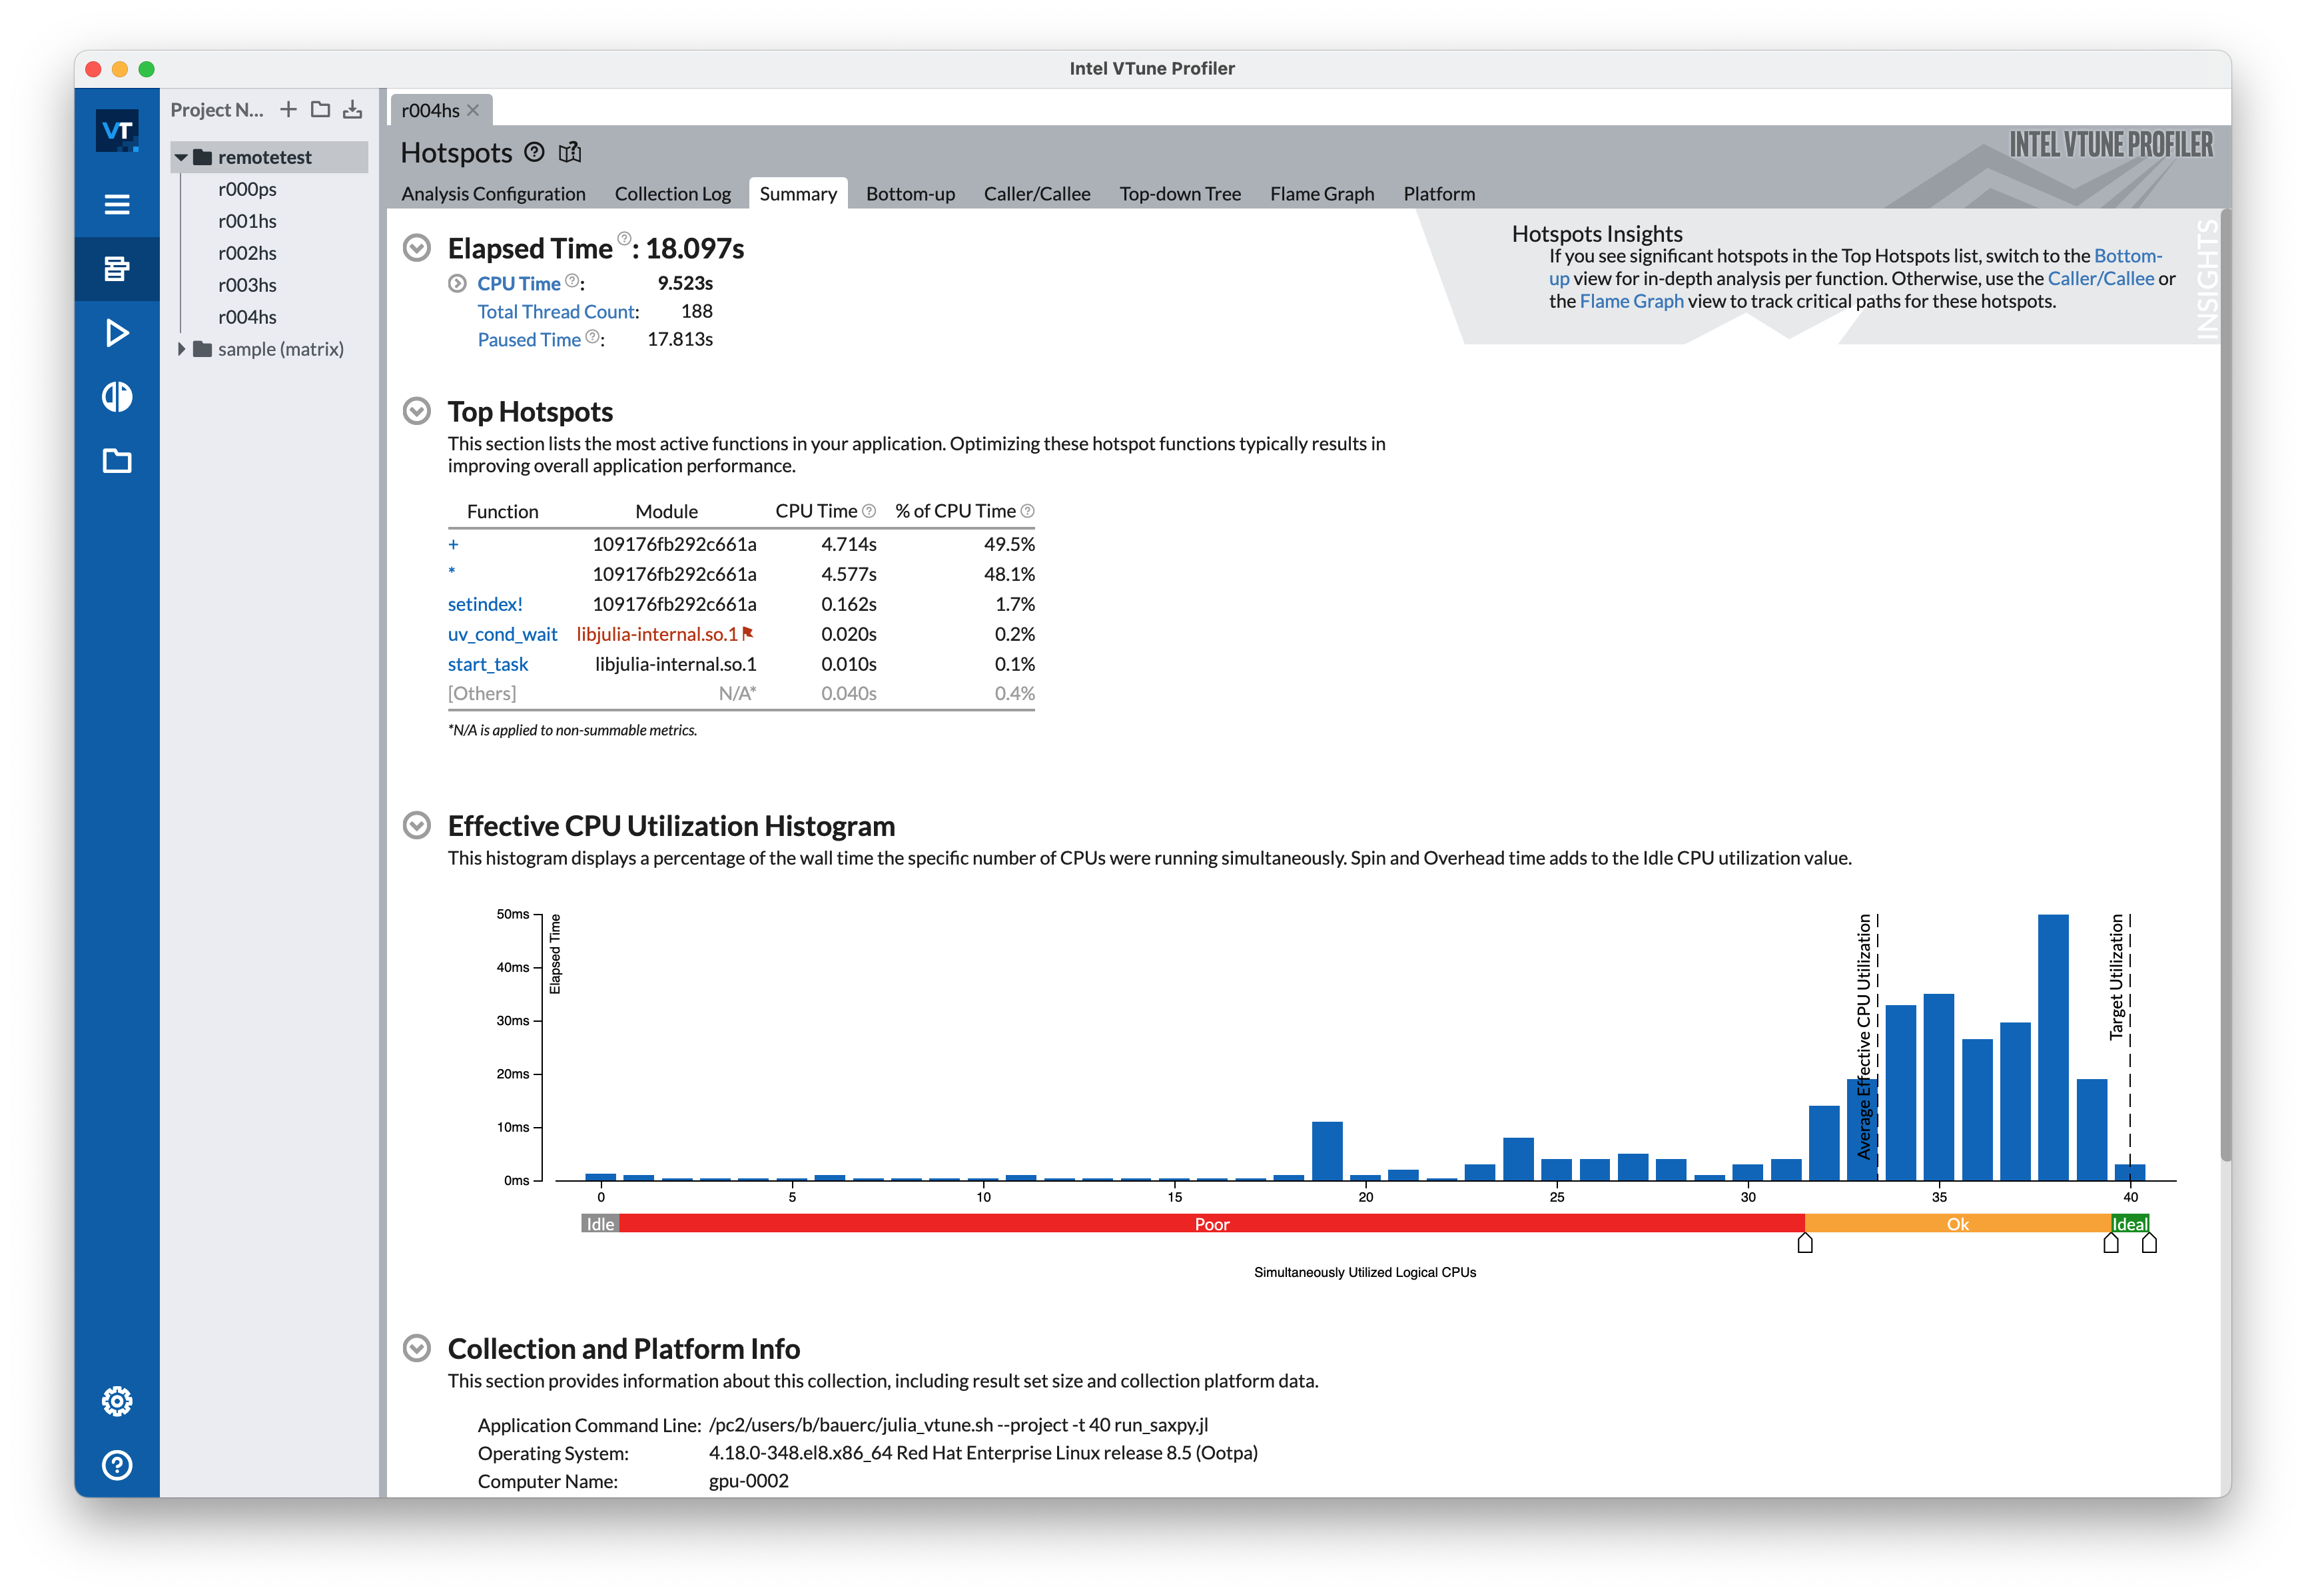
Summary

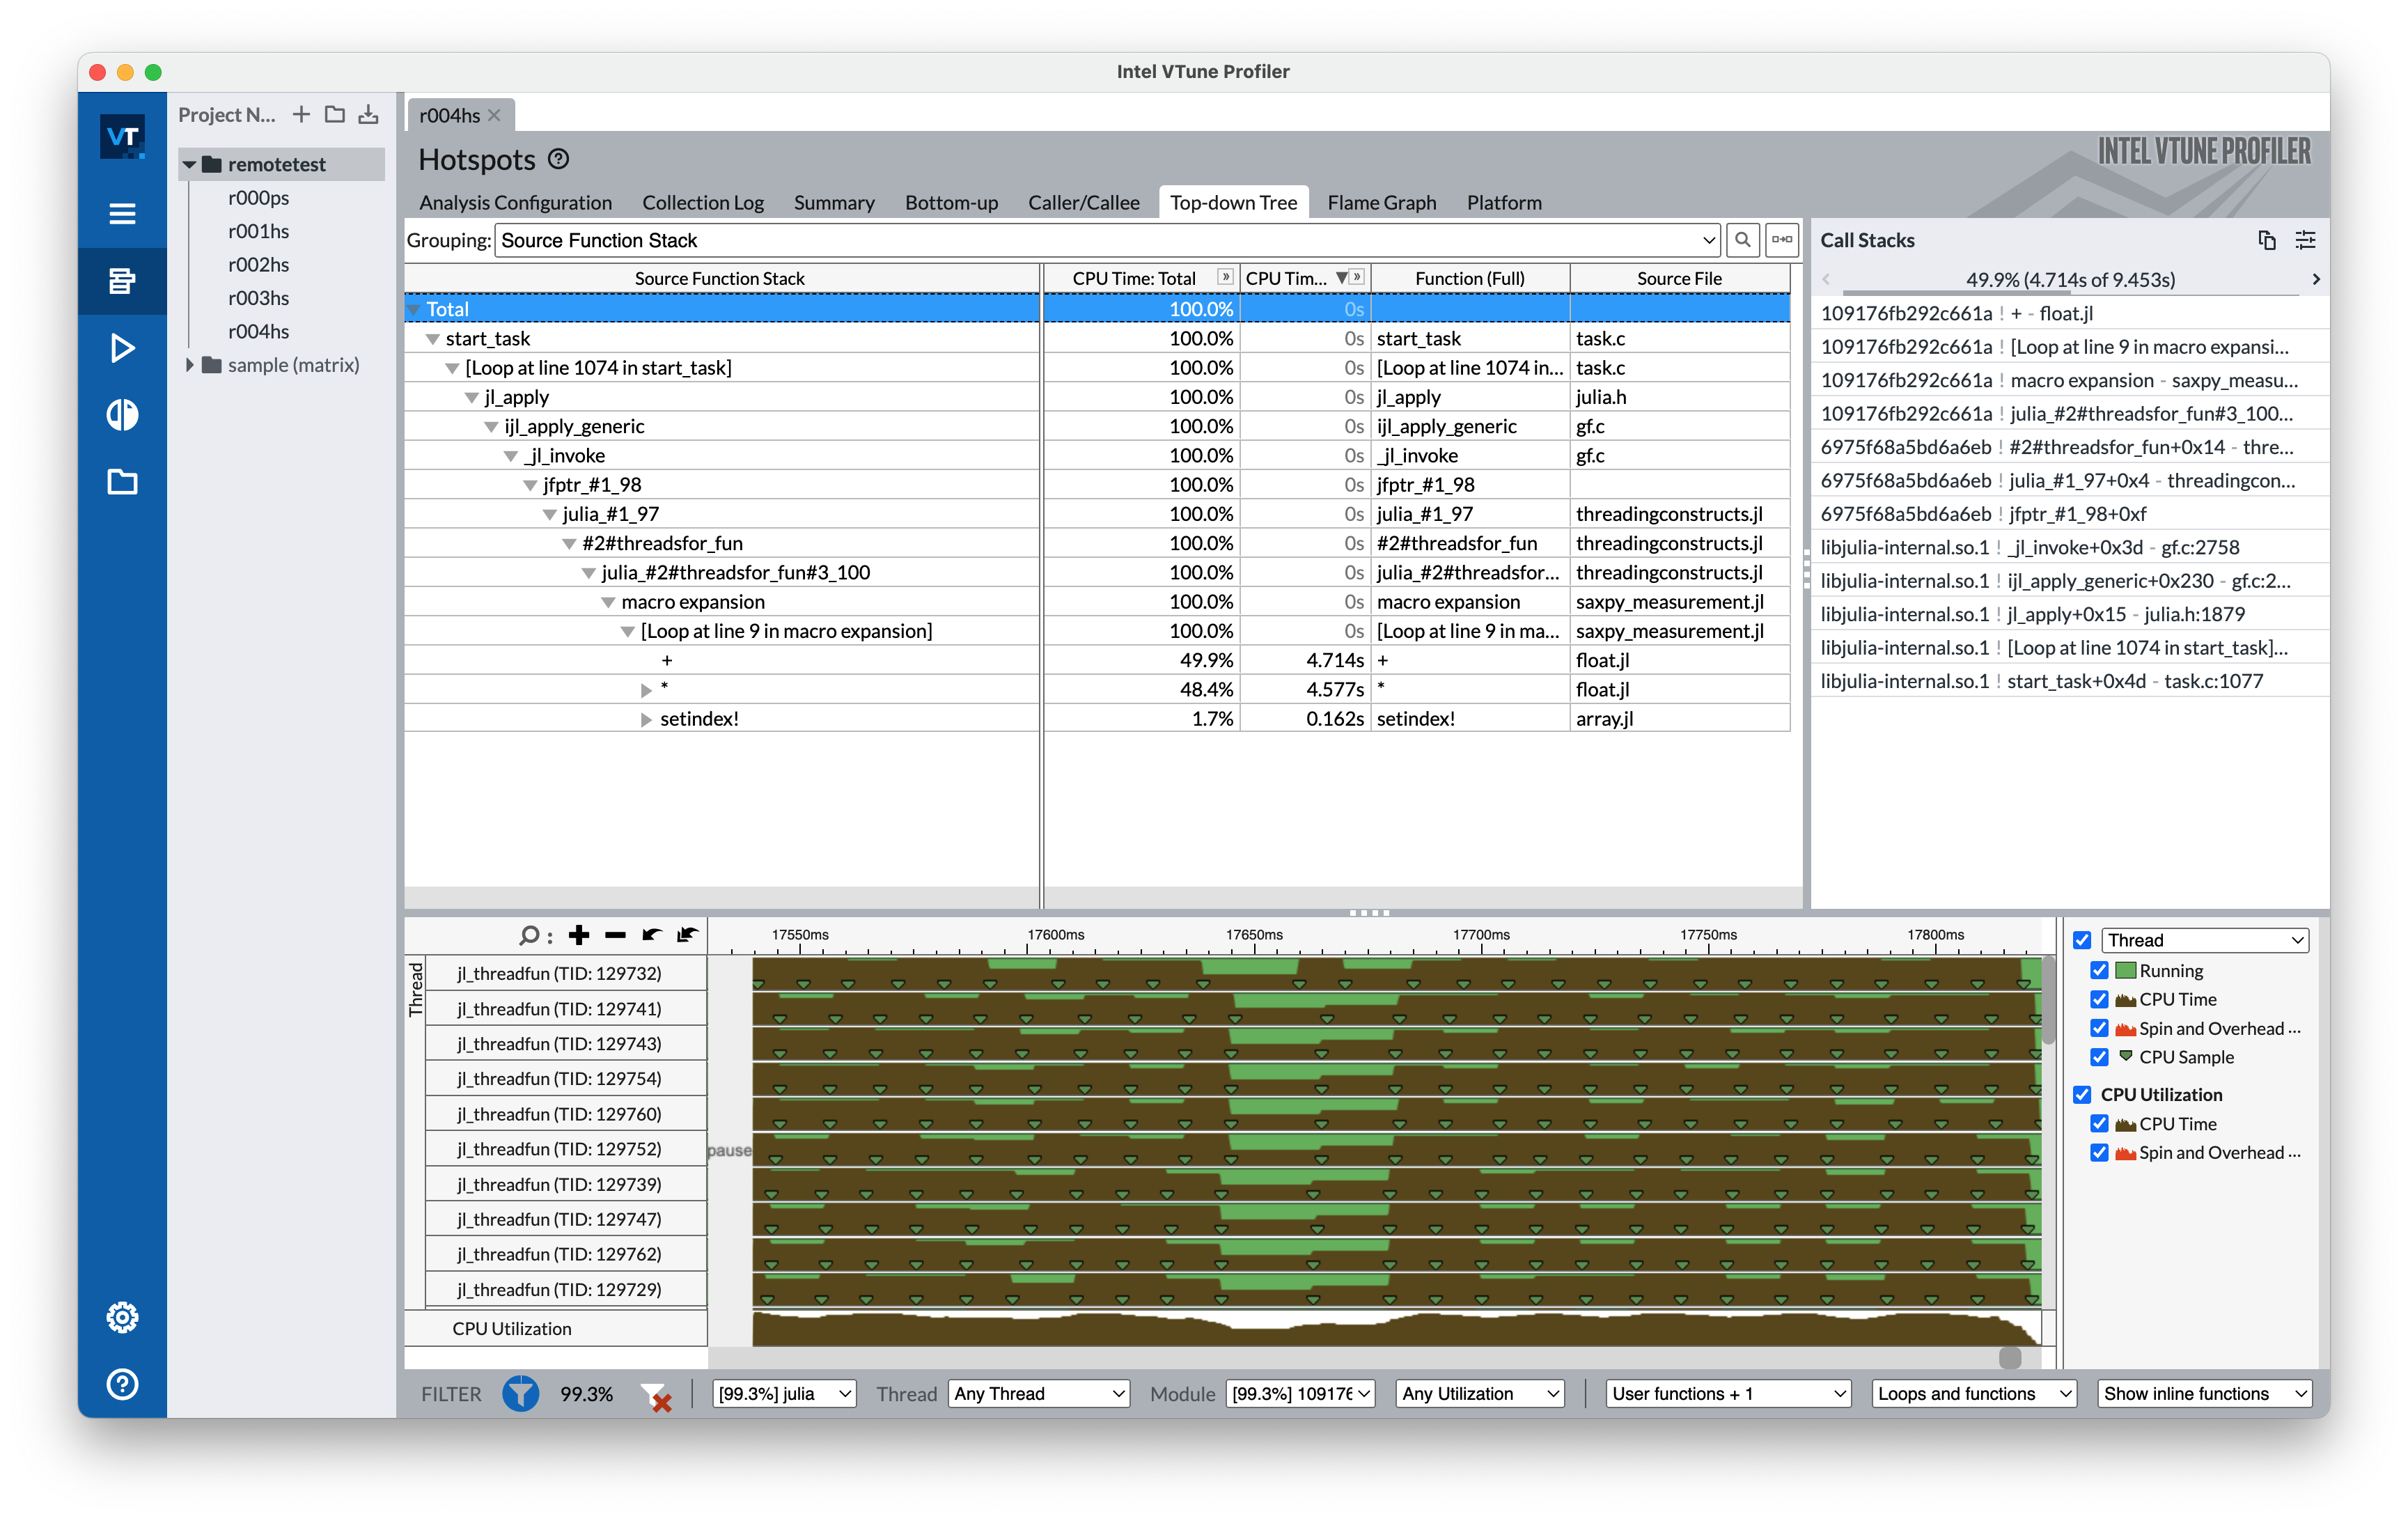
Top-down Tree

Comments
Due to how Julia works internally, your Julia functions appear with the prefix julia_ and a suffix _XX, where XX is a unique number, in the call stack. For example, the Julia function mysquare(x) = x^2 might appear as julia_mysquare_89.
In the SAXPY example above, we use @threads, which, under the hood, creates a function threadsfor_fun that will then get run (see the top-down tree above). Unfortunately, this can also cause problems like "cutting off" the call stack information as well as hindering source code resolution.
Source code resolution (i.e. "View Source") didn't work for me remotely. However, it gives you the option to point to the source file locally. This worked fine.
Useful commands:
Profiling: ENABLE_JITPROFILING=1 vtune -collect hotspots -start-paused -- julia --project mycode.jl
Open the results in the GUI: vtune-gui r000hs
Generating text reports:
vtune -report hotspots -r r000hs -group-by source-line > reports/hotspots.report
vtune -report top-down -r r000hs > reports/top_down.report
vtune -report callstacks -r r000hs > reports/callstacks.report
Check out the julia-intelvtune repository by Carsten Bauer which contains a basic demonstration.