There are plenty of HPC tools for profiling out there. Figuring out which one is good in what scenario and, more importantly, which one actually works with Julia is non-trivial. This page will try to provide helpful orientation.
Good for: GPU, MPI
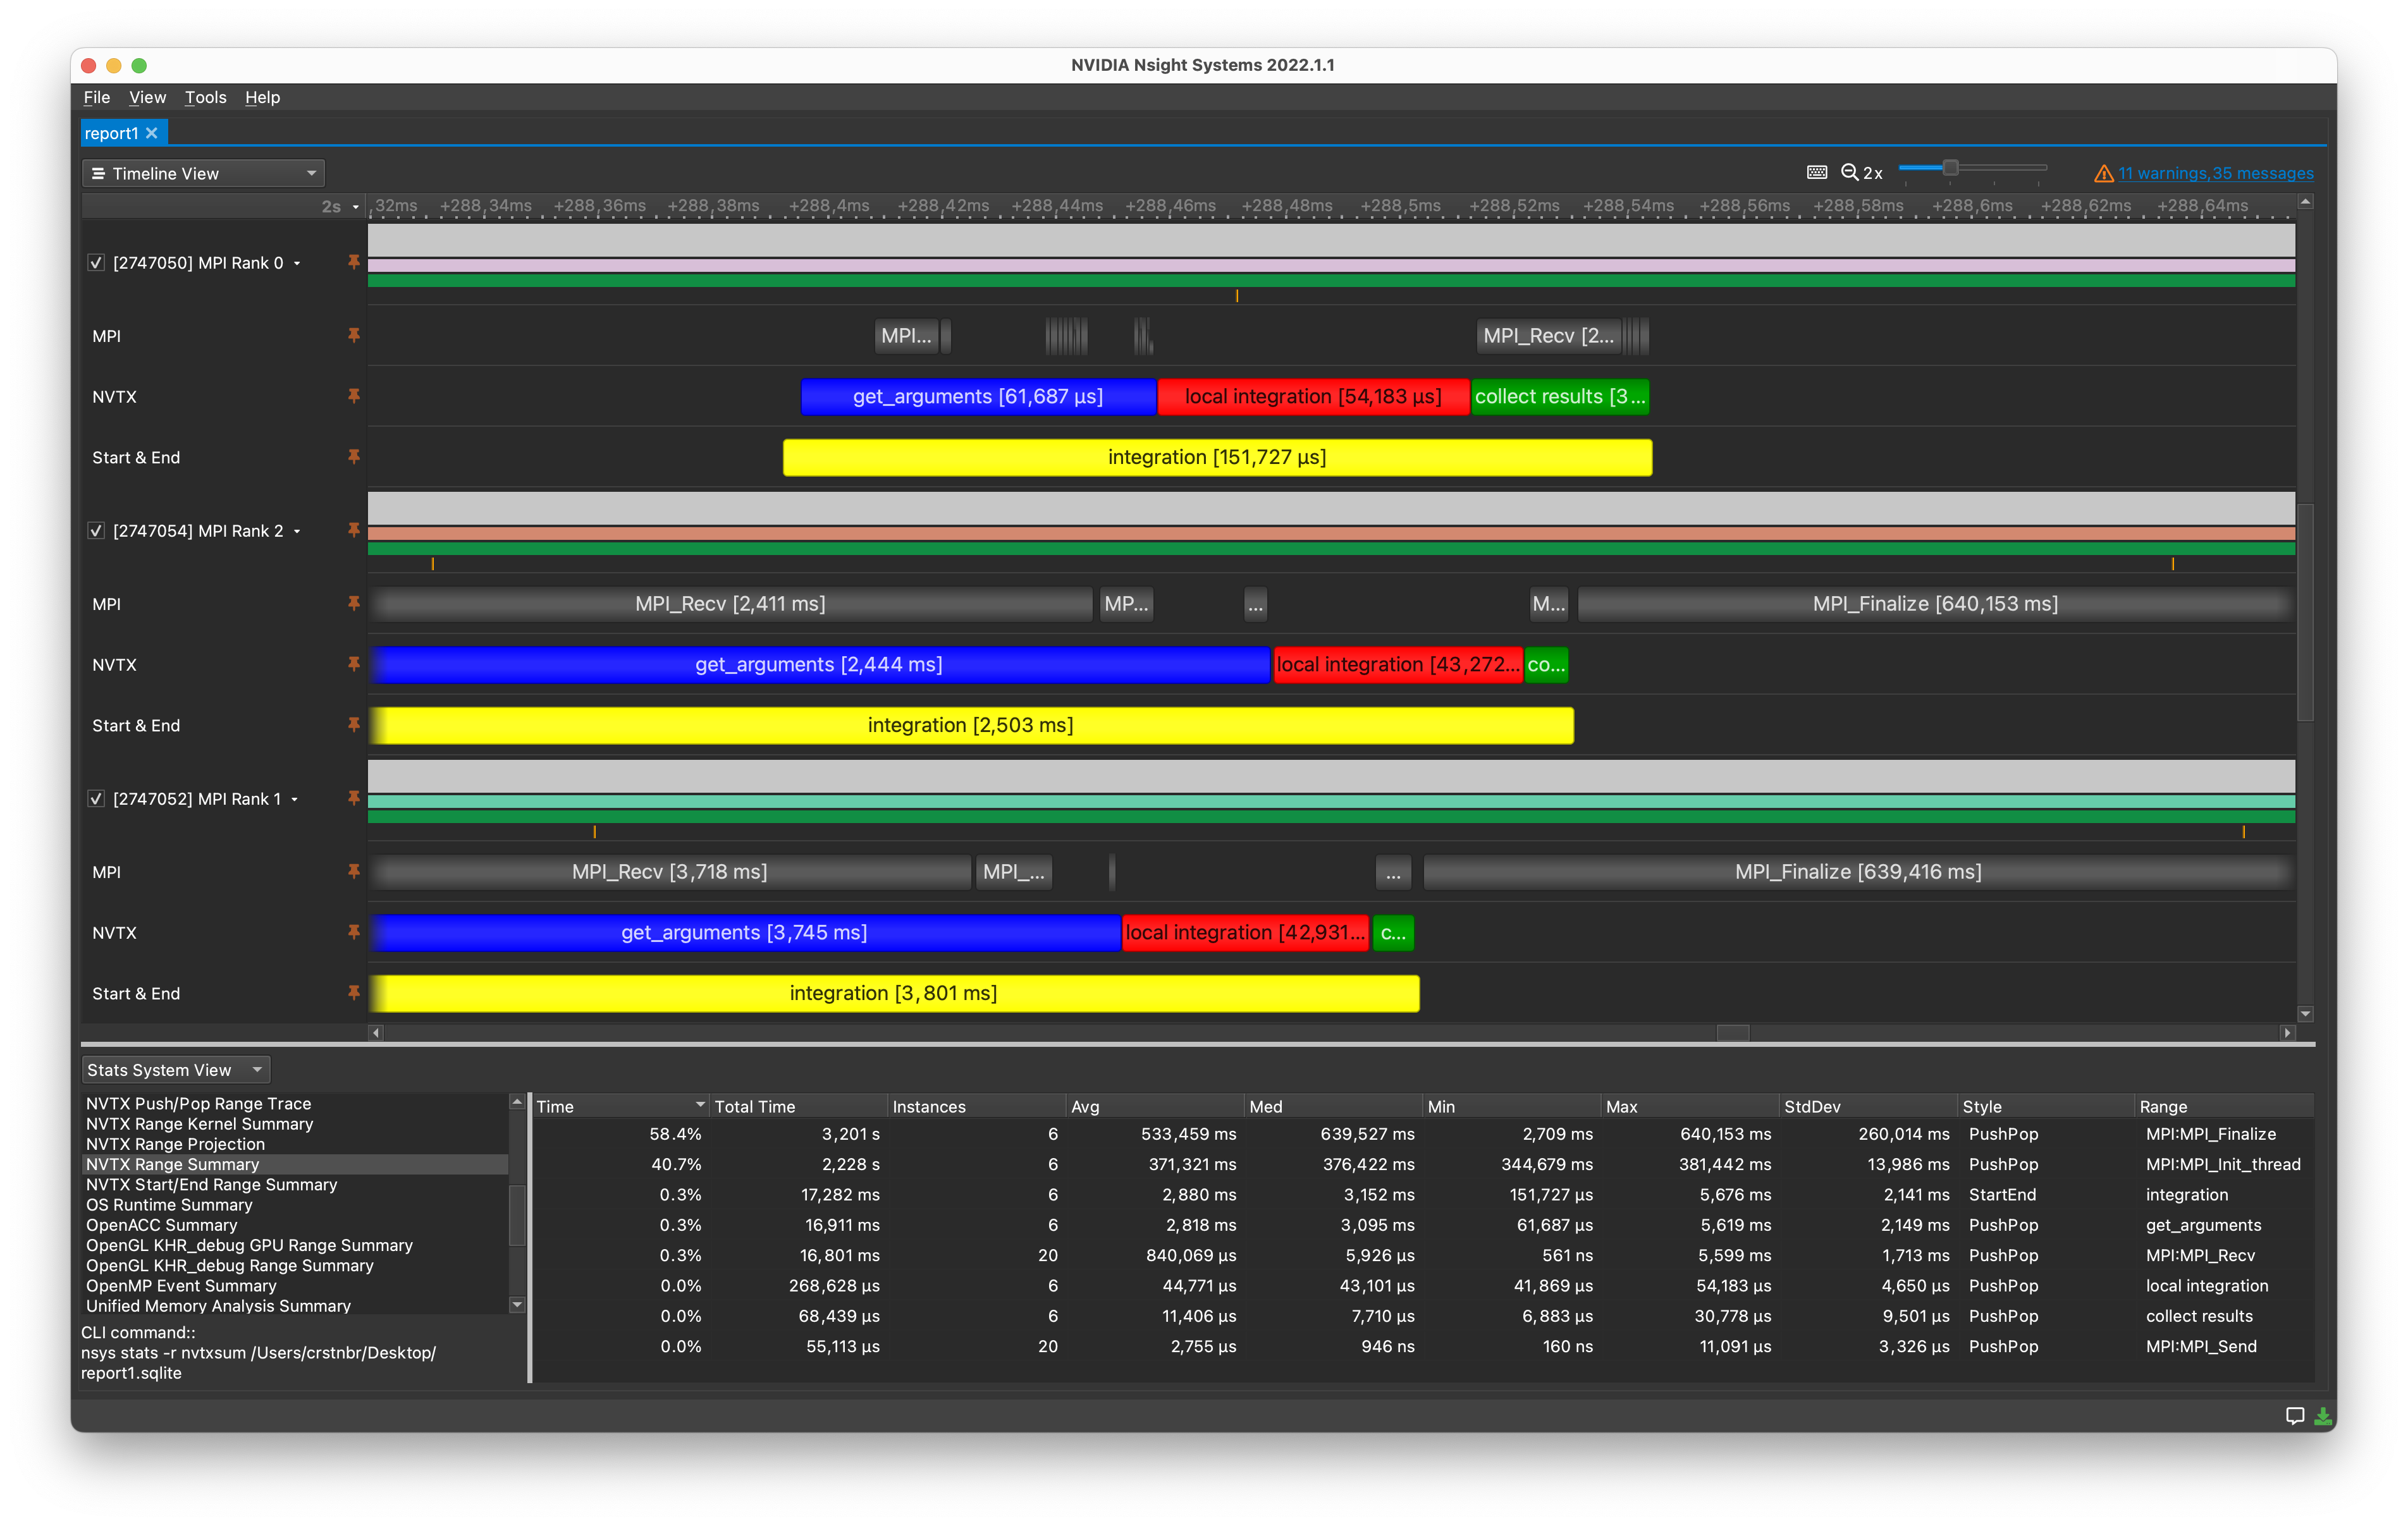
NVIDIA Nsight Systems is a powerful profiling tool for analyzing (multi-)GPU and/or MPI-parallel applications (the latter might be somewhat surprising). Especially useful when combined with NVTX.jl for manual instrumentation (you can name and even color sections of your code).
Examples:
Relevant section of the CUDA.jl documentation
Impressions:
Good for: MPI, GPU, Threads
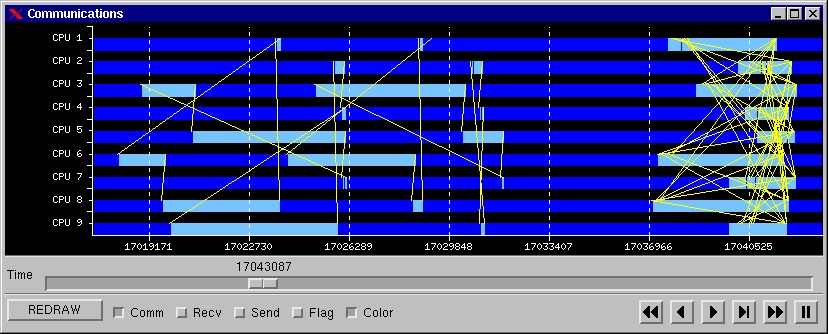
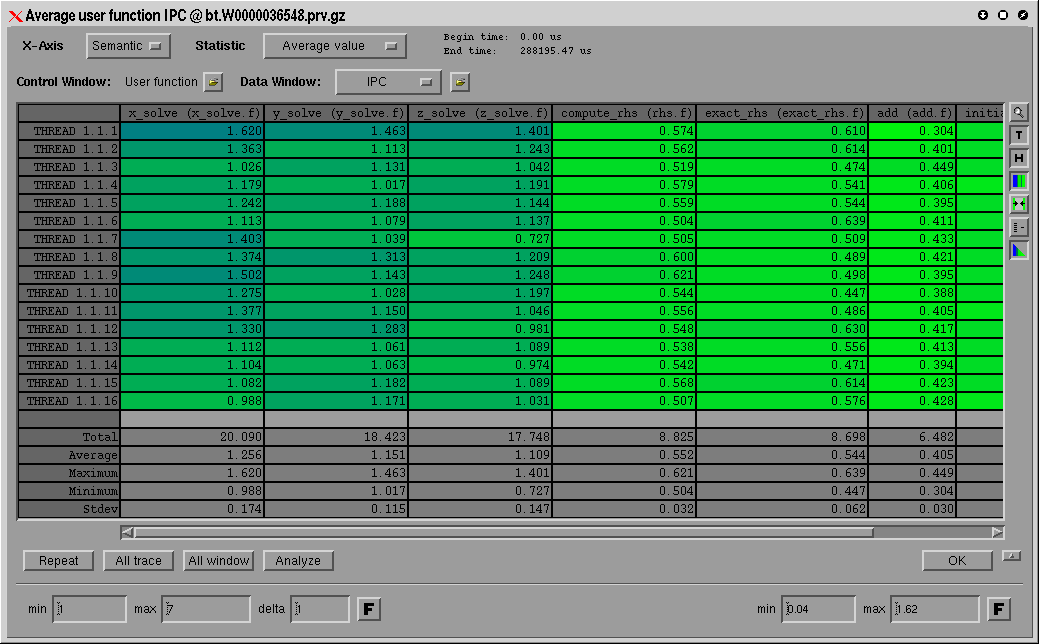
The Julia package Extrae.jl allows you to use Extrae for analyzing parallel Julia applications. It will produce trace files that can be visualized and analyzed with Paraver.
Noteworthy limitations:
The package isn't battle-tested.
The Paraver GUI might be overwhelming and takes some getting used to.
Only works on Linux.
Impressions (of Paraver):
Good for: MPI
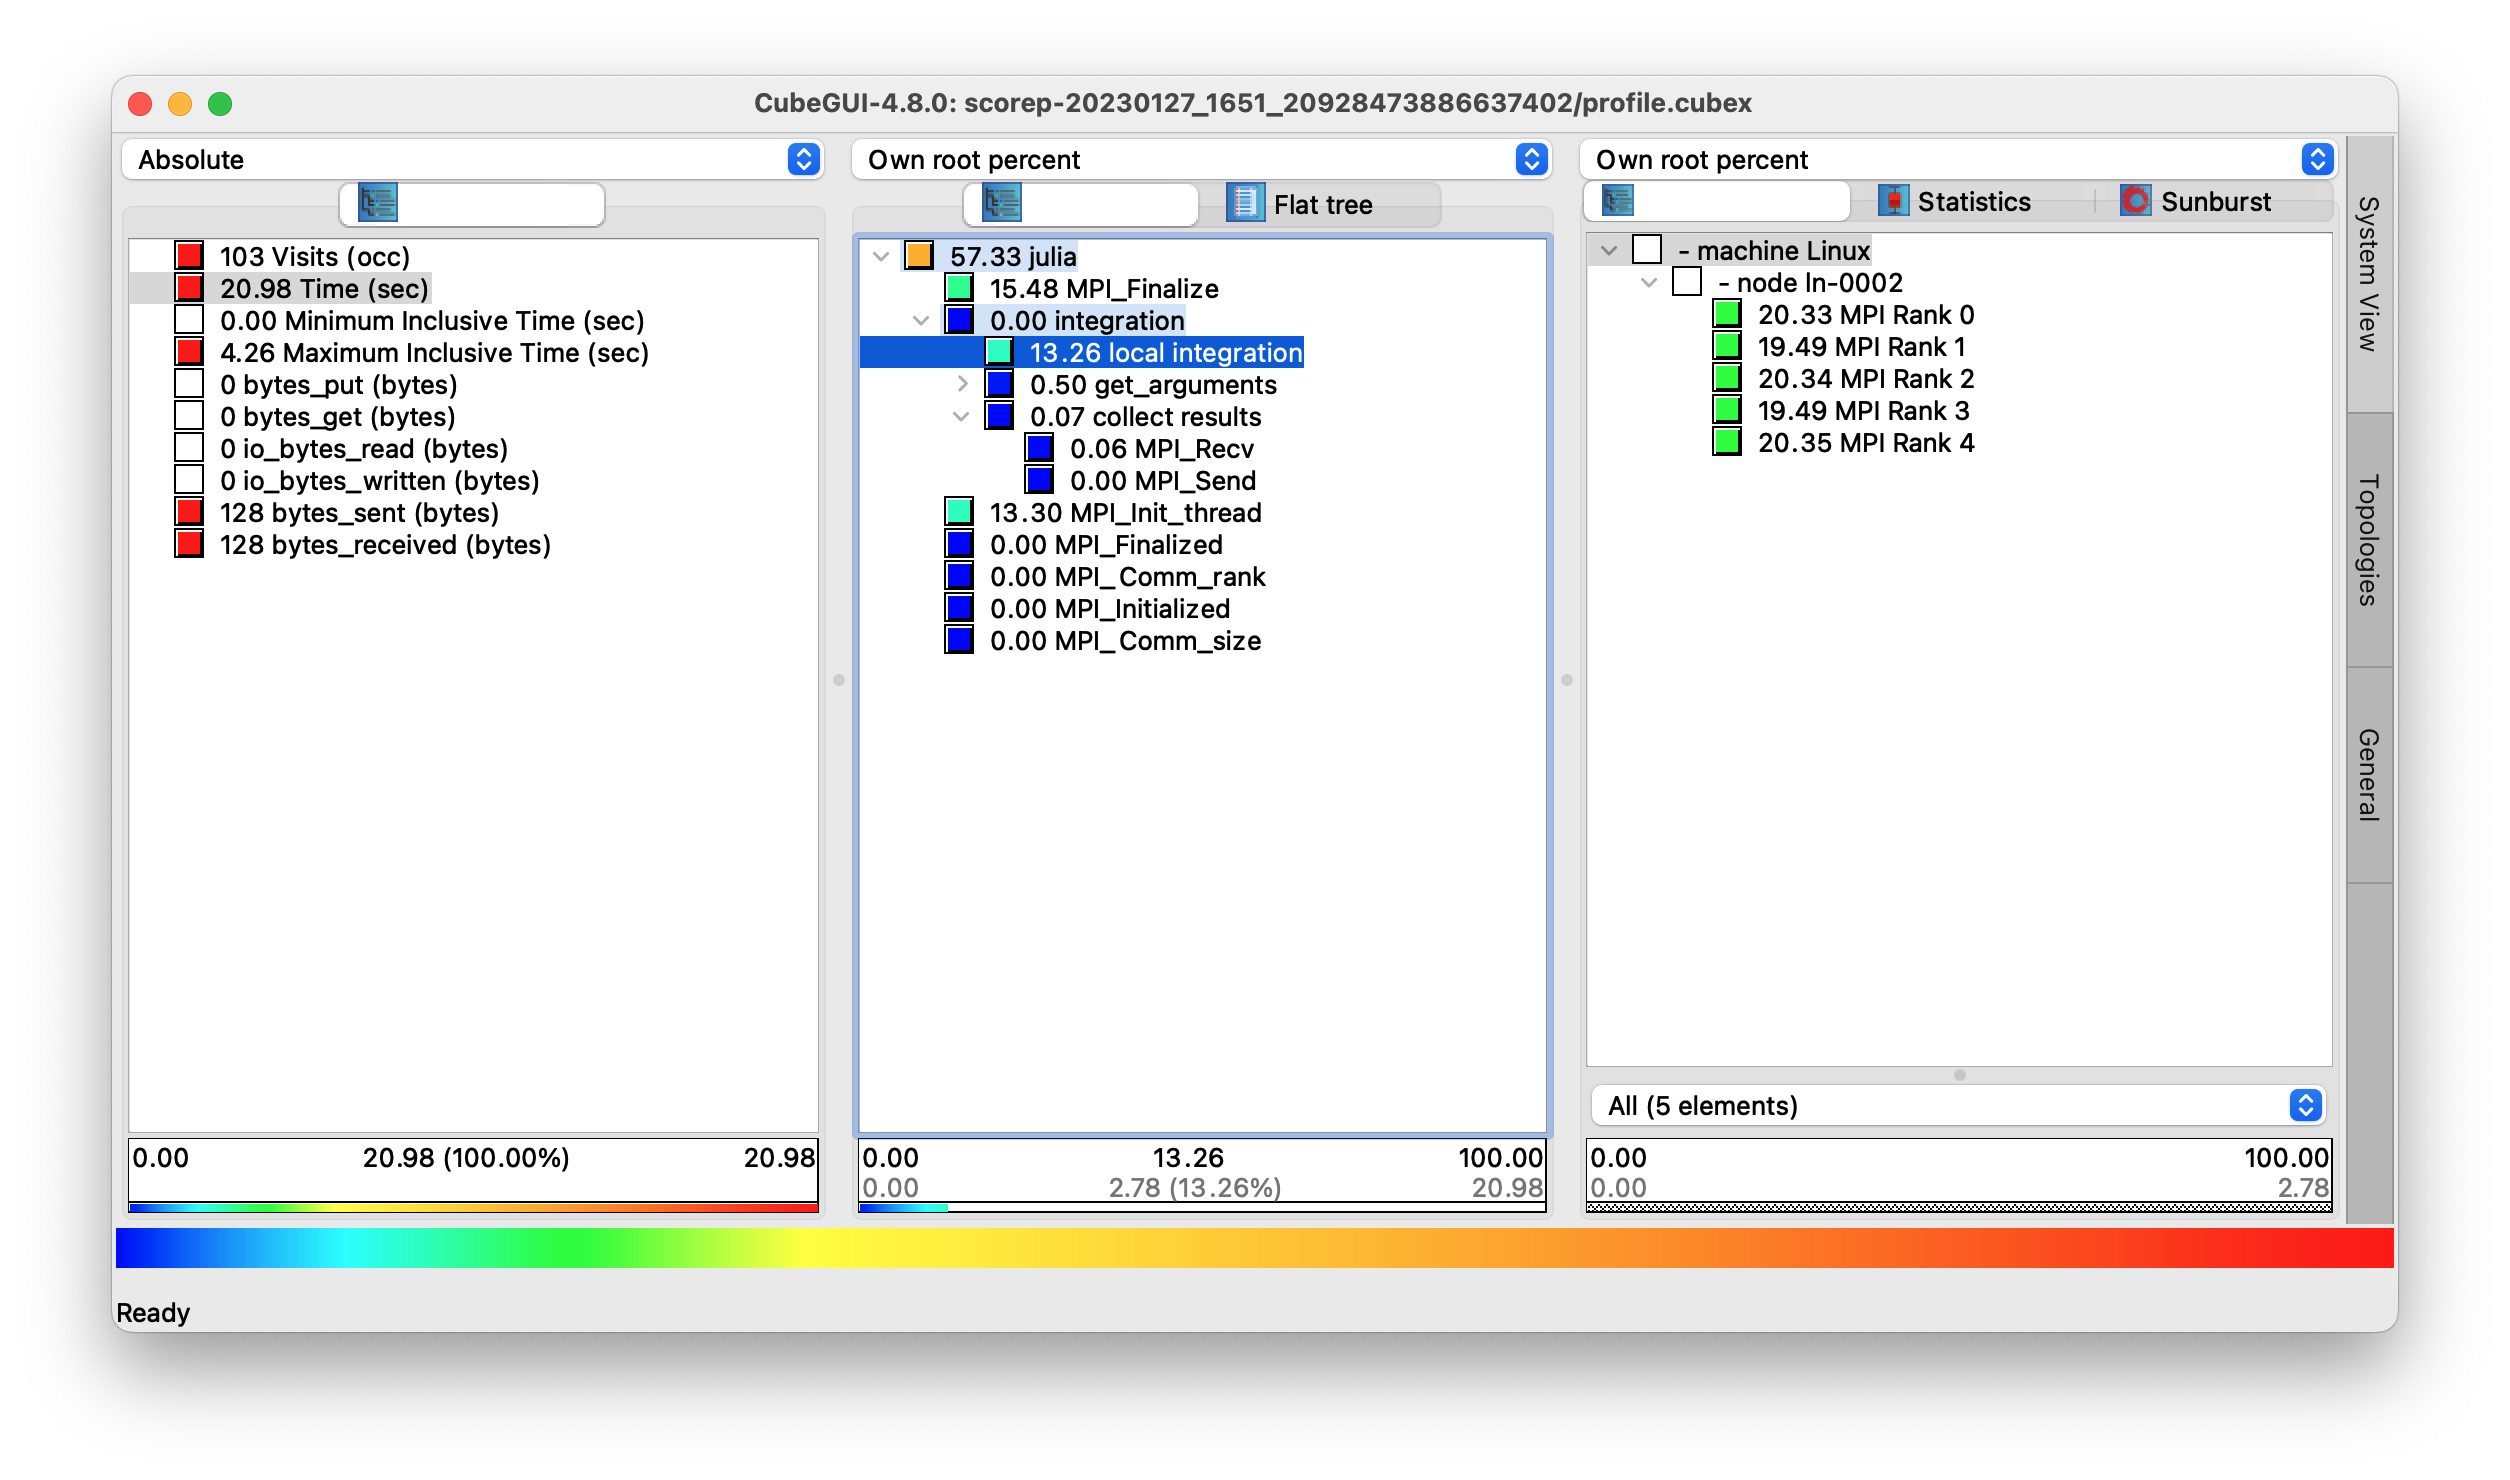
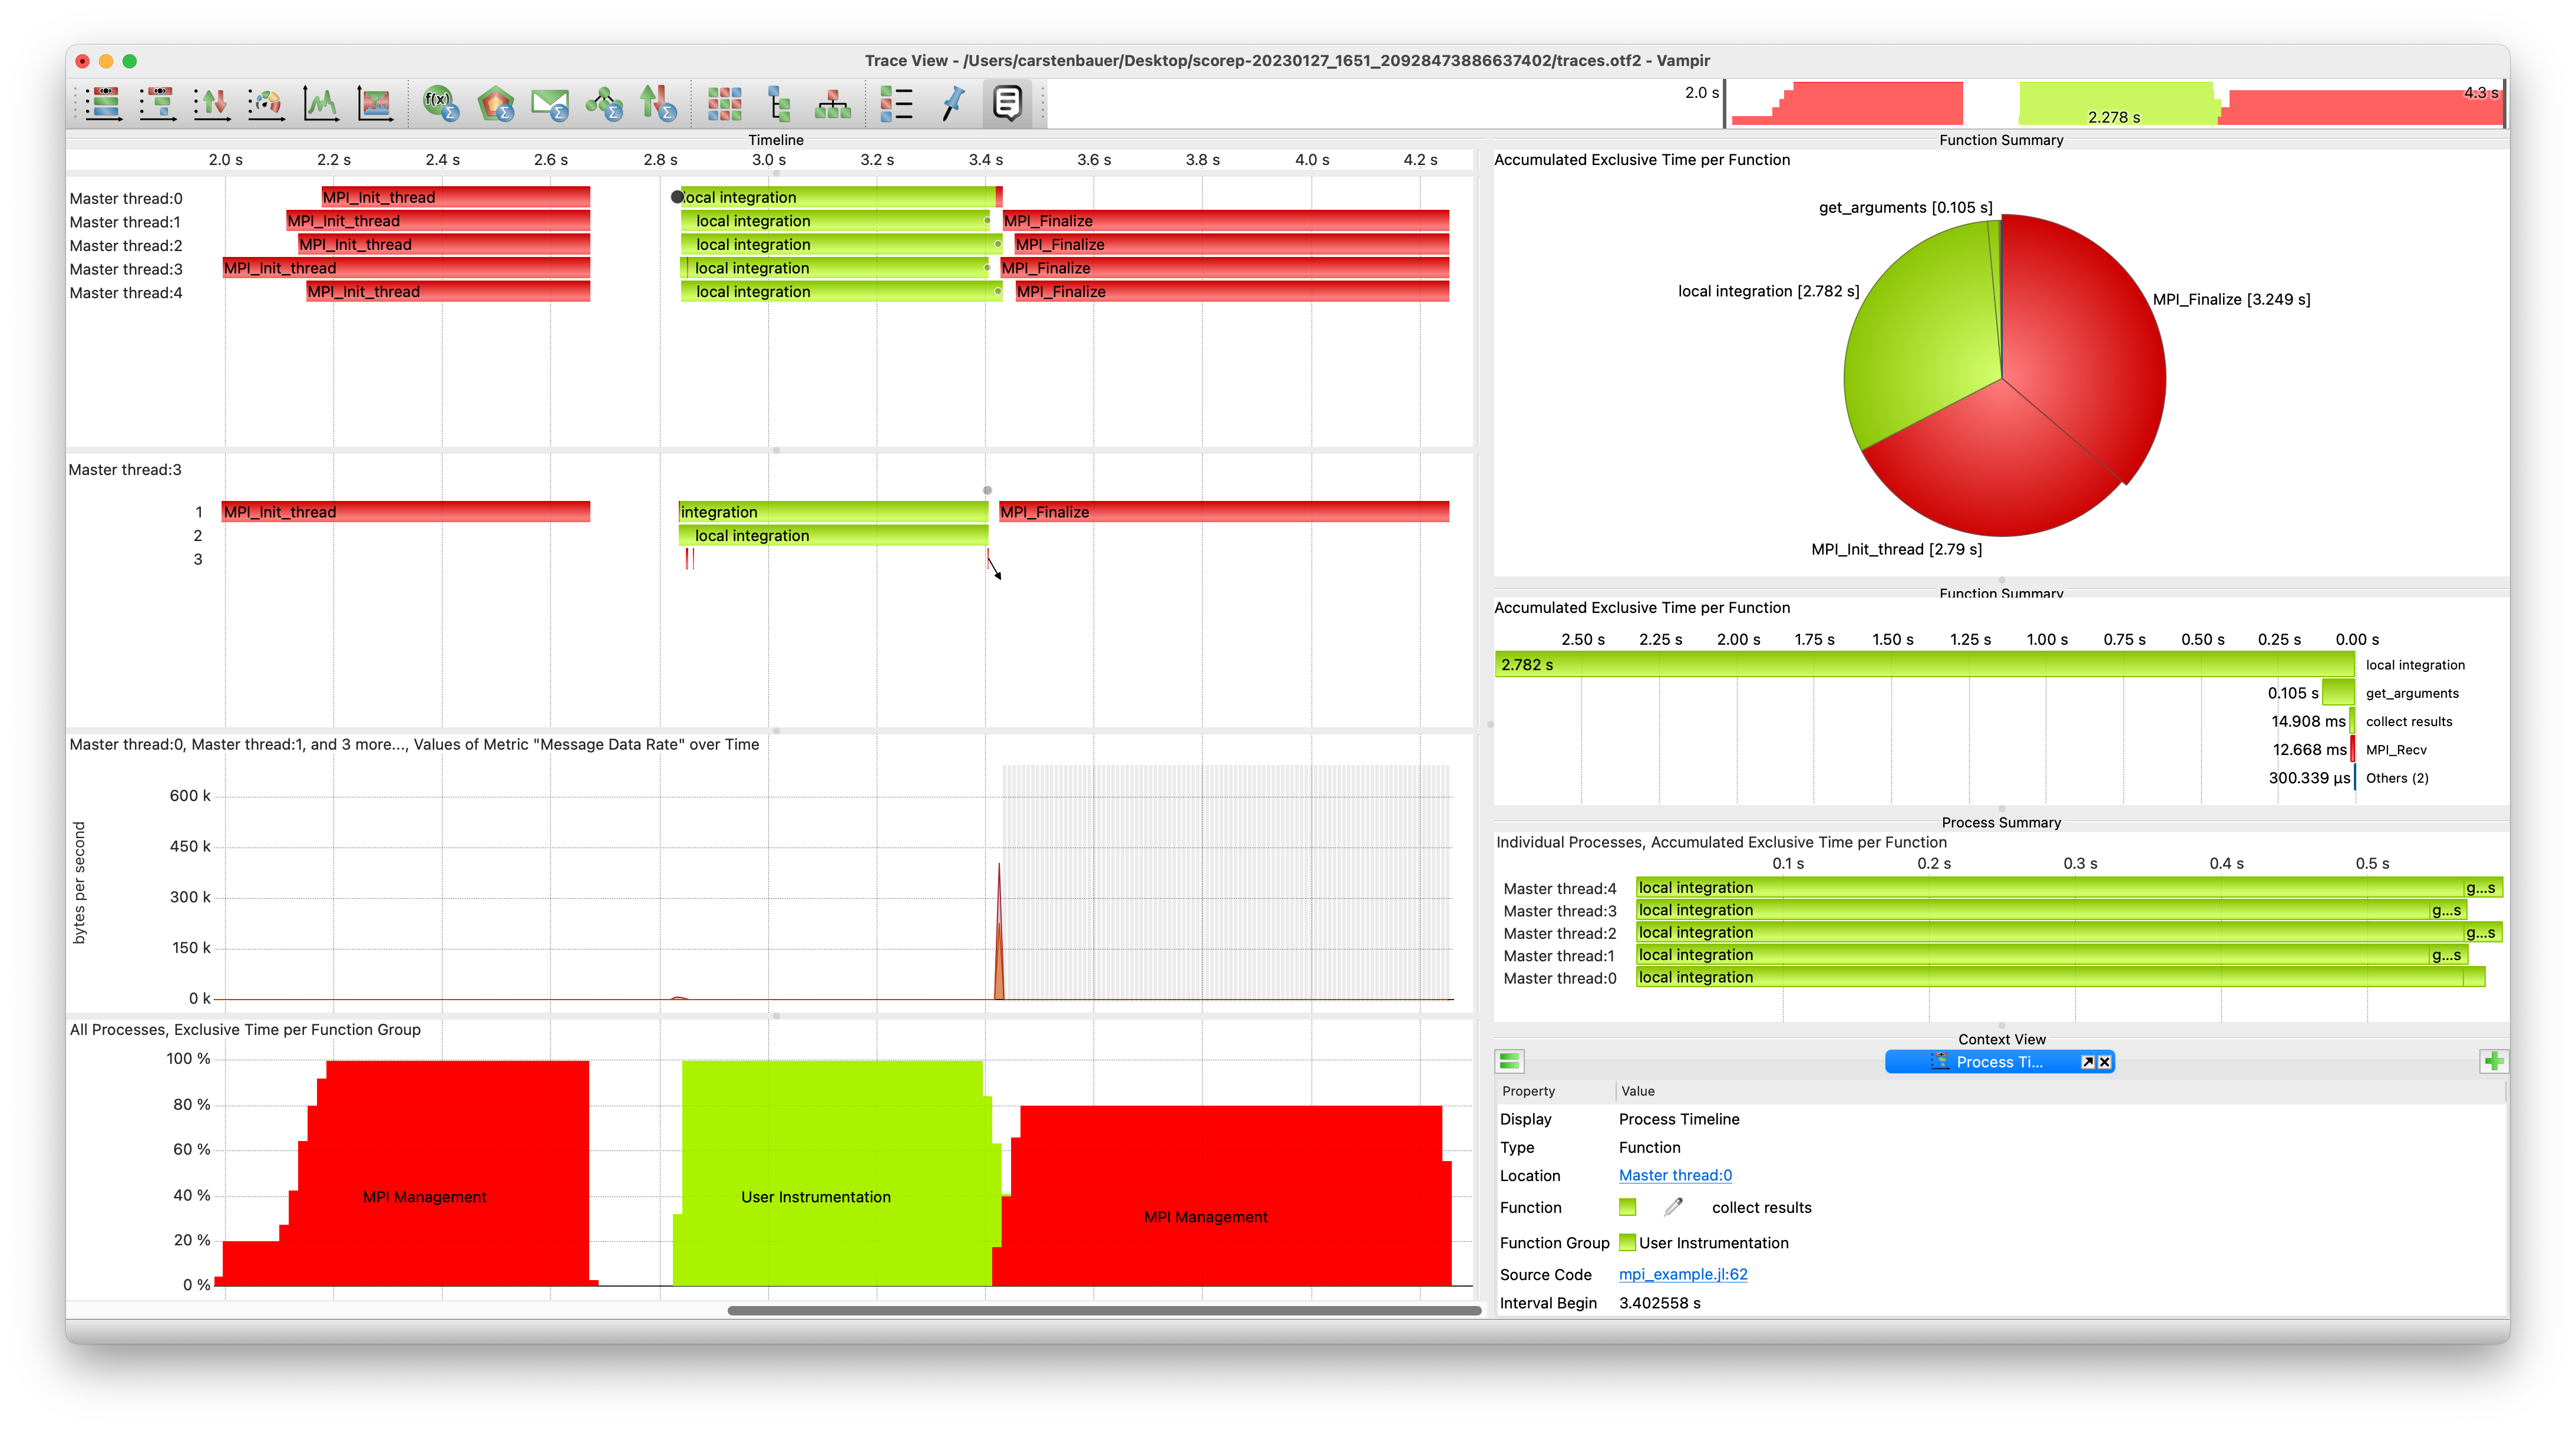
The Julia package ScoreP.jl allows you to use Score-P for analyzing MPI-parallel Julia applications. Output files are of type .cubex (profiling), which can be opened with, e.g., Cube or ParaProf, and .otf2 (tracing), which can be opened with, e.g., Vampir or Intel Trace Analyzer.
Noteworthy limitations:
The package isn't battle-tested and currently experimental.
While manual instrumentation works, automatic tracing of Julia functions isn't (yet) supported.
Examples:
You're best chance is to check out the README.md.
Only works on Linux.
Impressions (of Cube and Vampir):
Good for: intra-node hardware-level profiling
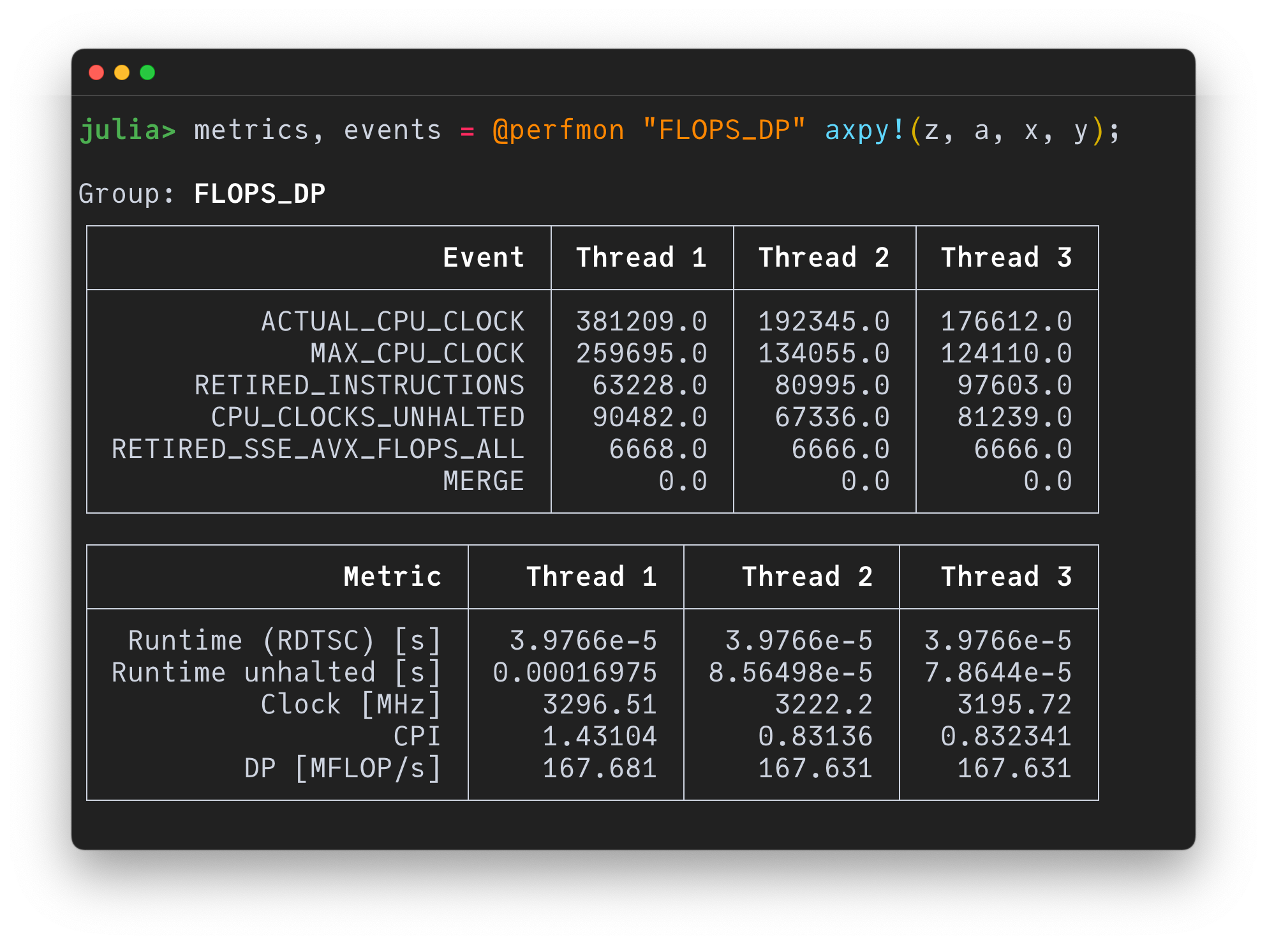
LIKWID.jl, named after the underlying eponymous benchmarking suite LIKWID, enables (interactive) monitoring of the performance of arbitrary Julia functions on a hardware level by examining hardware performance counters inside of CPUs (and NVIDIA GPUs).
Noteworthy limitations:
Manual installation of LIKWID necessary (no JLL).
Some features marked as experimental (but basic core is solid).
Only works on Linux.
Examples:
Counting floating point operations of arbitrary Julia functions.
Monitoring Performance on a Hardware Level With LIKWID.jl | Carsten Bauer | JuliaCon 2022
Impressions:
Good for: serial, multithreading, GC
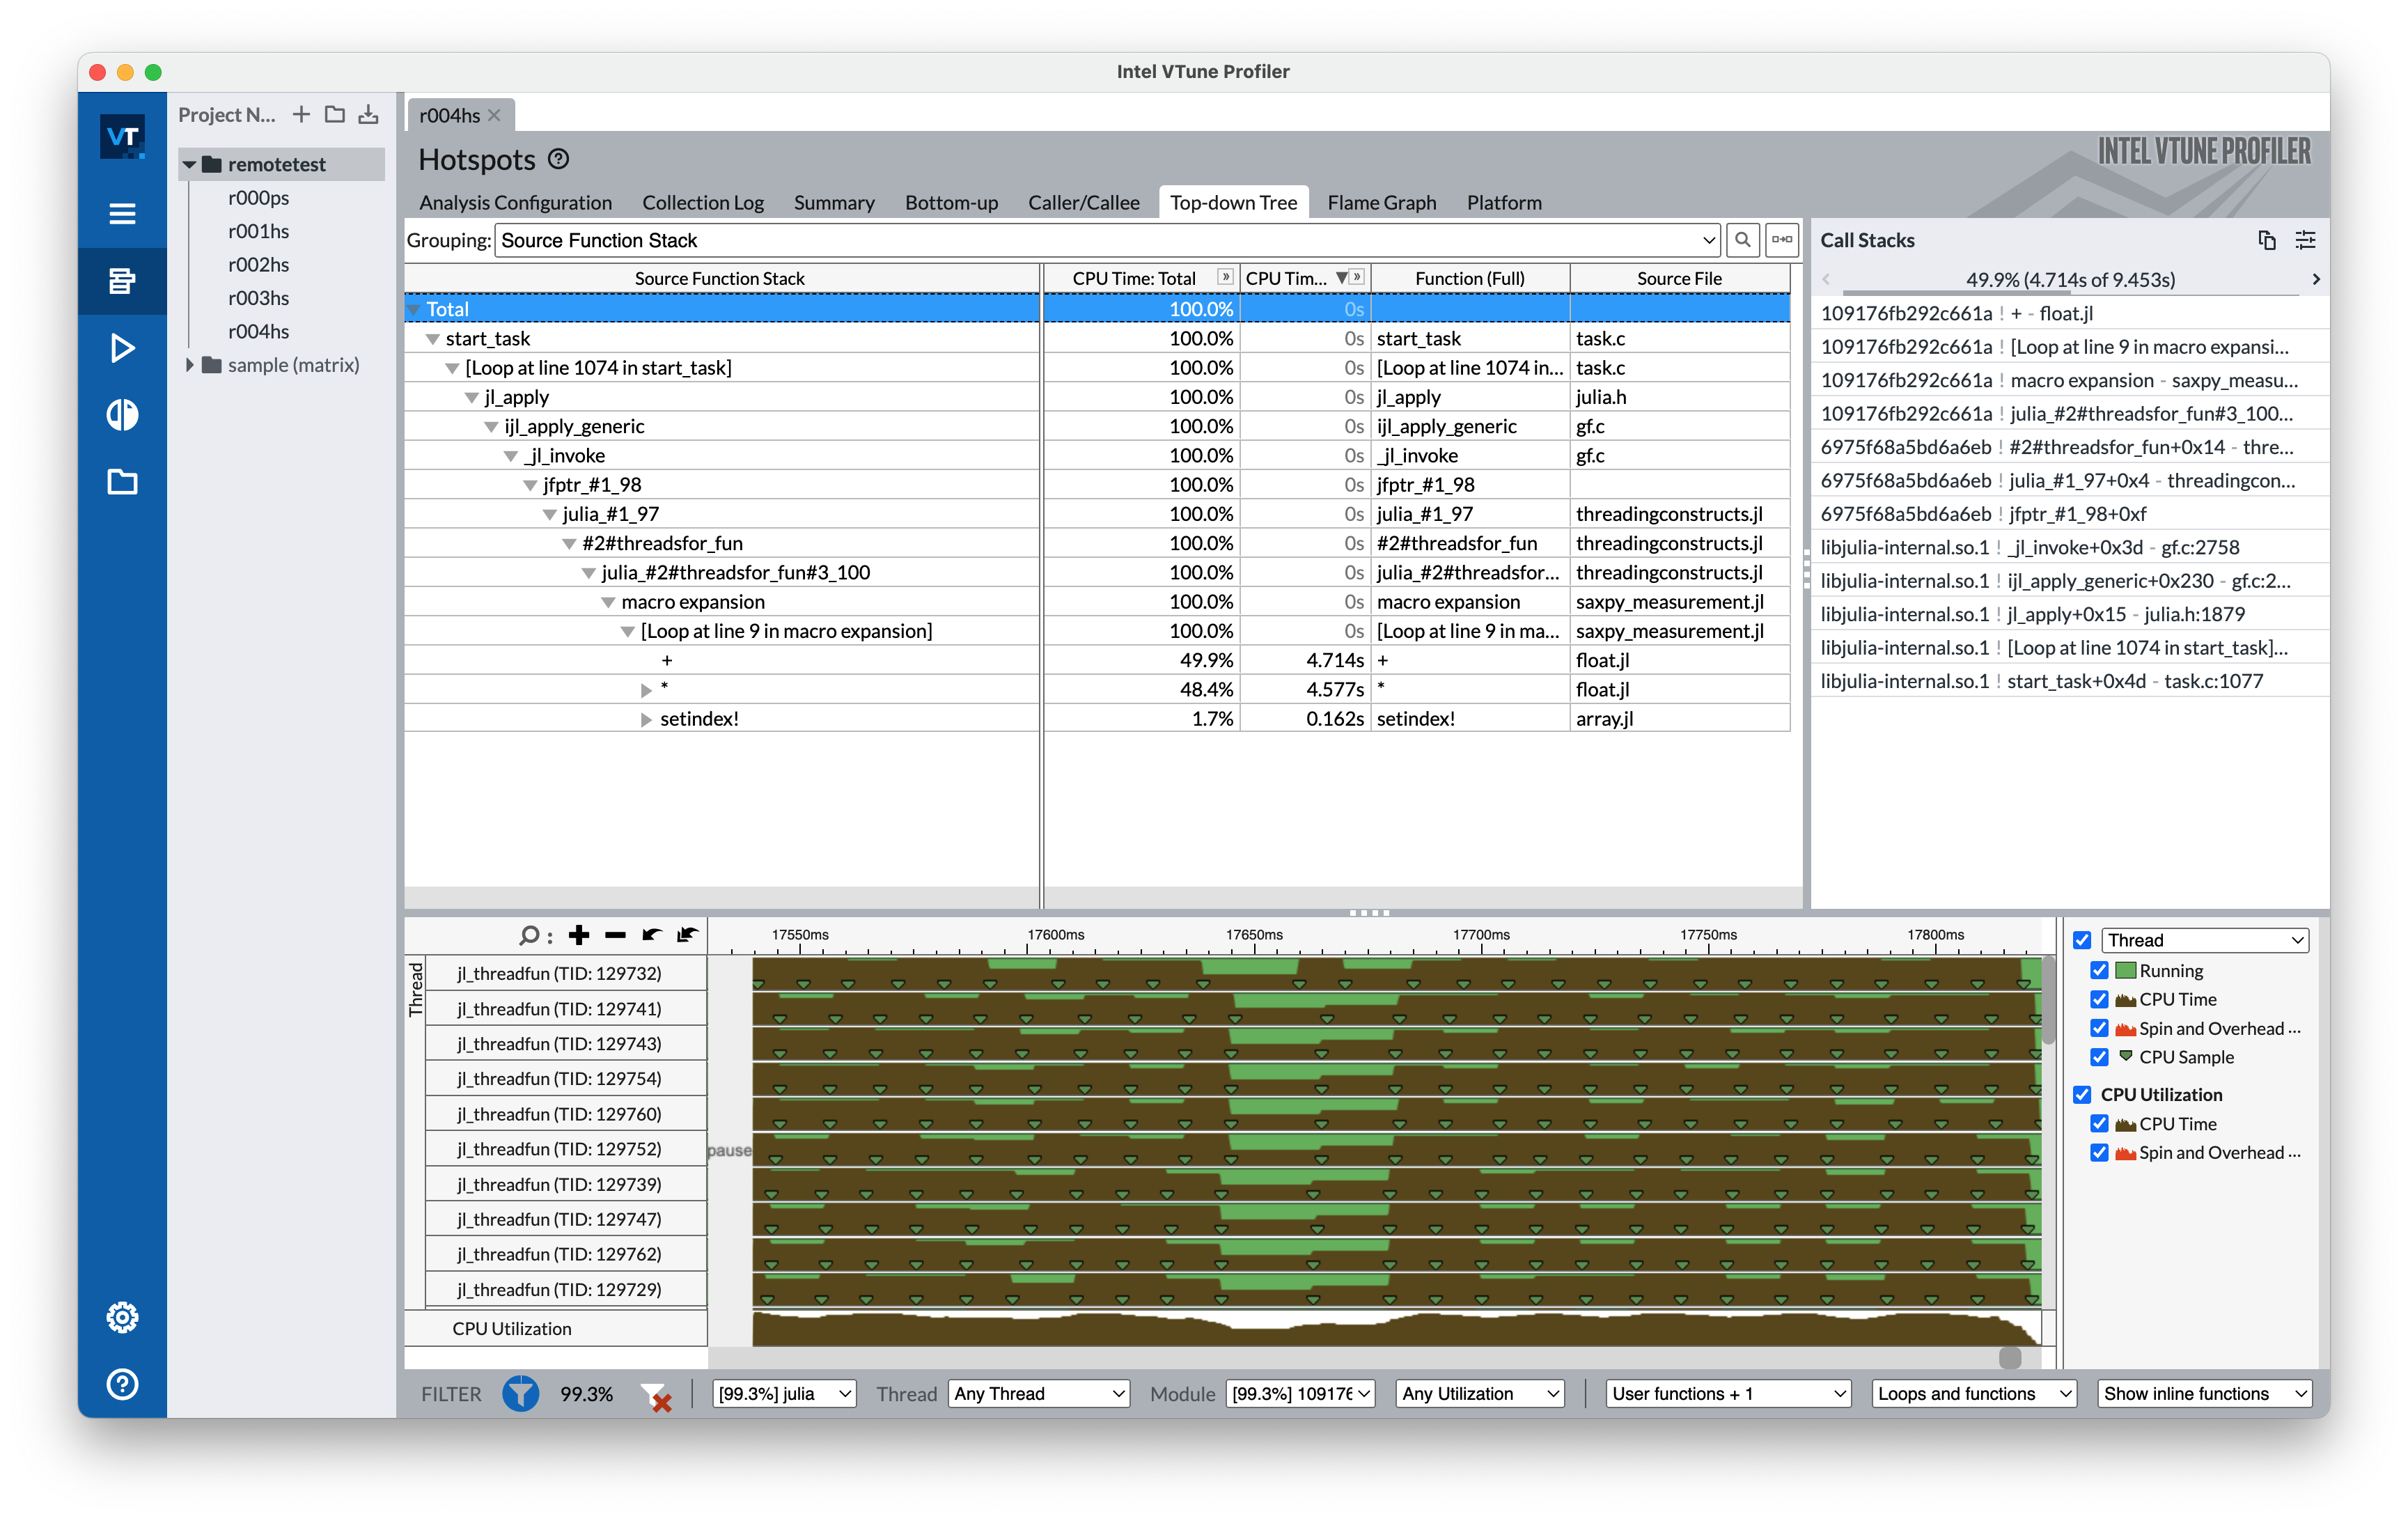
The Intel VTune Profiler is a nice tool, e.g., for finding hot spots in your code. It supports local and remote performance profiling. To make it work with Julia check out IntelITT.jl and our dedicated Intel VTune + Julia page.
Noteworthy limitations:
Works best (only?) on systems with Intel CPUs.
Can't profile on macOS (only remotely on Linux machine).
May require compiling Julia from source (if you want more details, e.g., about GC).
Examples:
Intel VTune + Julia (e.g. remote usage via GUI)
Impressions:
If you know something about the following tools, in particular if and how it supports Julia, please make a PR!
MUST (MPI runtime correctness analysis)